
I had the good fortune of being invited to come give the opening keynote address for the CoastGIS 2013 conference being held in Victoria BC this week. I got the invite after Dawn Wright of OSU and ESRI fame had to cancel. I actually was really looking forward to re-connecting with Dawn and hearing her talk… she is always inspiring. It turned out that this was a great opportunity for me to work with my team at NOAA to come up with a compelling rendition of our experience during the Deepwater Horizon oil spill. It also allowed me to re-connect at the conference with many people I used to work with in the “Marine GIS” space during my years at Ecotrust.
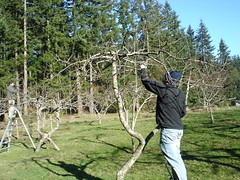
The ferry ride up from Anacortes to Sidney BC was glorious… always a very relaxing a beautiful journey. Straight down to Victoria to get settled for the night at the Marriot. Was fortunate enough to hook up for dinner with my good buddy Anthony Lukach (from our local CUGOS group, who now lives in Victoria). Off to the conference bright and early the next morning at the University of Victoria. A stroll through campus with my coffee and camera was a perfect way to kick of what was an excellent day.

The conference was opened with a song/prayer/story session from two elders from the local Coast and Straits Salish People. It gave me goose bumps and I have to say I have been thinking about their message for the last 2 days. The affects of modern society on indigenous people is a sad story without a clear solution… yet the positive energy from the speakers was inspiring.
I had the privilege to kick the conference off with the story of ERMA… which is really the story of how we are trying to drive the next generation of “Response Management” tools from within NOAA. It is a story of small teams of people doing big things, of positive lessons learned from horrific events, and the story of Open Source and Open Data. From the reactions I got in person and on twitter I think the message resonated with the audience and I am very glad I was able to share our story.

For this talk I used the really cool JS/CSS presentation framework Reveal.js. I love the concept of Markdown (as this blog is using Octopress and markdown, hosted on gitpages) so I ended up stripping down the Reveal.js stuff to basically allow me to write my entire presentation in a single Markdown file, yet render as a Reveal.js presentation. The starter for that is on my github account called revealz (I like adding z’s to everything… since my company is called Z-Pulley Inc!). I think I will be using this as the starter for presentations moving forward. Using Markdown under version control just has so many benefits.
The other great thing is that you can just post your slides to gitpages and be sharing… so in that light here are the slides from my CoastGIS 2013 keynote:

My approach to making Reveal.js presentations is that the right arrow will cycle you through the main slides, but if the down arrow is active, use it to reveal backup points or more detail on a topic. Pretty simple…
I have also posted some pictures on Flickr of the journey up to the conference. We truly do live in one of the most spectacular parts of the world.
To the conference committee of CoastGIS 2013, thanks for the invite. I had a great time and I hope my participation added something fun and interesting to your conference!
]]>


 Well, as of July 8th I have made the transition out of Ecotrust and now am working on a contract basis full time. I am very excited about the move and look forward to continuing on with some of my ongoing contract work as well as starting to hit the pavement and drum up some new work. More to come as I get my feet on the ground and back up and running!
]]>
Well, as of July 8th I have made the transition out of Ecotrust and now am working on a contract basis full time. I am very excited about the move and look forward to continuing on with some of my ongoing contract work as well as starting to hit the pavement and drum up some new work. More to come as I get my feet on the ground and back up and running!
]]>
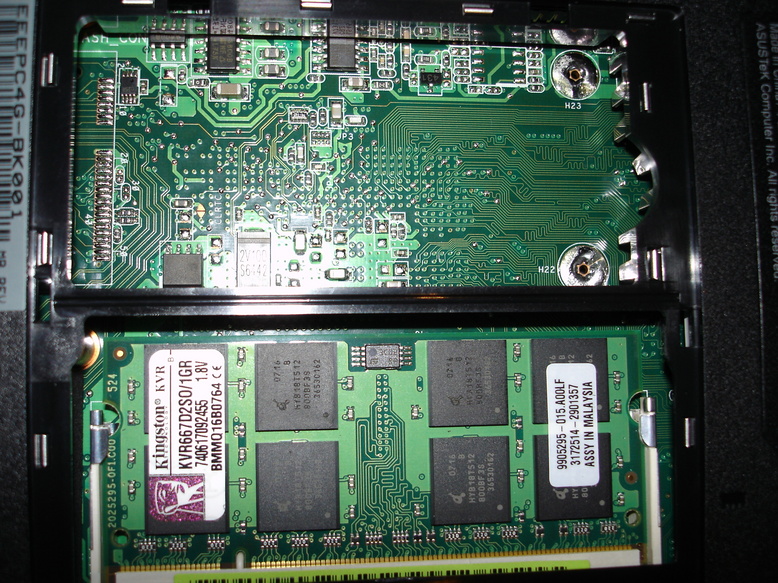 New RAM going in…
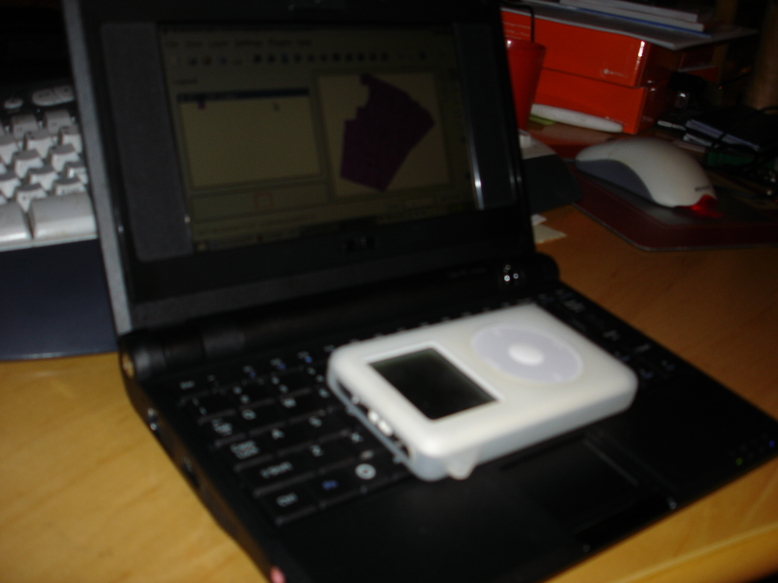 Size compare with an IPOD…
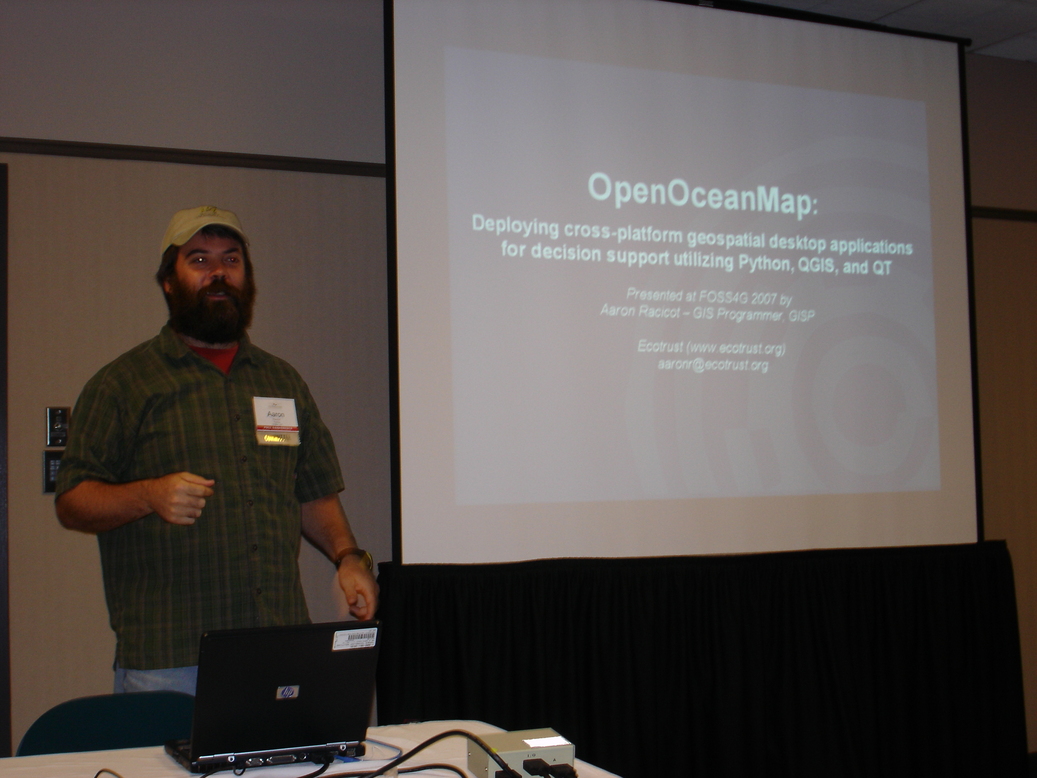